12 - 13 NOVEMBER 1997 - RELATIVE STREAMS: FRONTAL AND PRE-FRONTAL SITUATION
by ZAMG
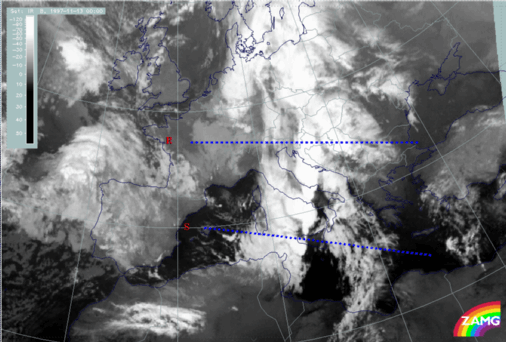
At this point of time the area of most interest moved away from the cloudiness in front of the Cold Front to the area of the Cold Front cloud band itself, where during the last six hours a line of large thunderstorms developed at the leading edge. The interpretation close to the superadiabatic frontal surfaces is quite difficult but still possible in view of a separation of relative streams, which have different origin.
|
13 November 1997/00.00 UTC - Meteosat IR image; position of vertical cross sections R and S indicated
|
|
|
|
|
|
|
|
|
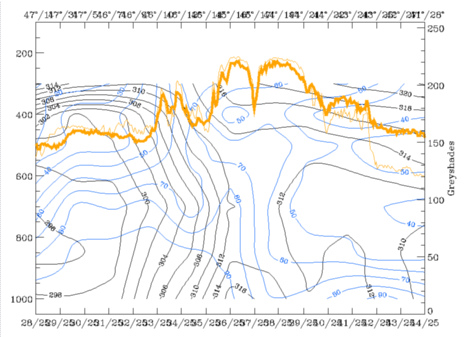
13 November 1997/00.00 UTC - Vertical cross section R; black: isentropes (ThetaE), blue: relative humidity, orange thin: IR pixel values,
orange thick: WV pixel values
|
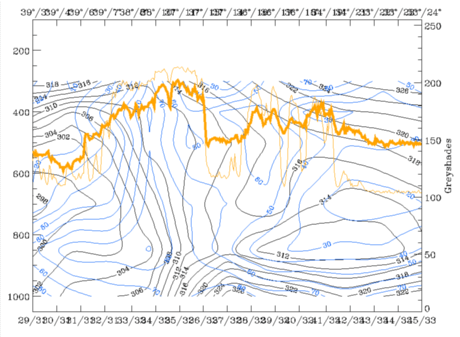
13 November 1997/00.00 UTC - Vertical cross section S; black: isentropes (ThetaE), blue: relative humidity, orange thin: IR pixel values,
orange thick: WV pixel values
|
In the northern vertical cross section (cross section R) crossing Croatia, the ThetaE surface 312K is on top of the frontal surface and is inclined very steeply and partly superadiabatic down to the surface; a tongue of wet air creeps upward to about 400 hPa (left image). A surface with similar features is ThetaE 311K for the southern vertical cross section S (right image). The interpretation has to consider that relative streams can only be interpreted down to about 700 hPa in the areas of interest; below this the isentropic surfaces are superadiabatic and nearly perpendicular to the surface. The isentropic surfaces 314K and 316K are already above the frontal surface and so in the area of interest the interpretation is not restricted.
|
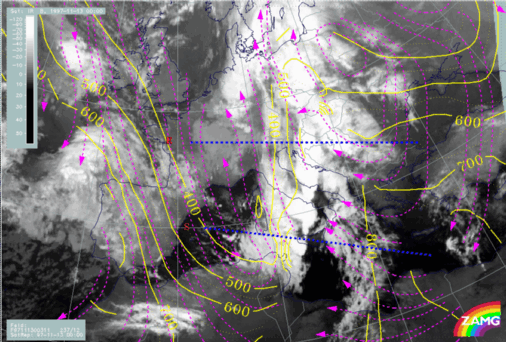
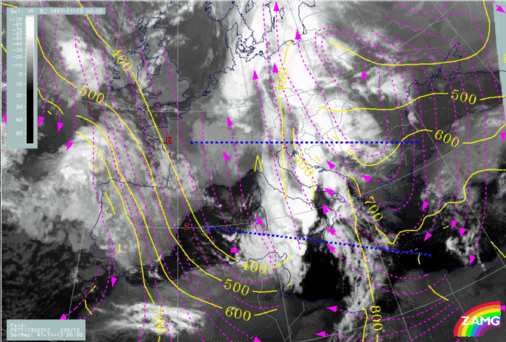
13 November 1997/00.00 UTC - Meteosat IR image; magenta: relative streams 311K - system velocity 237° 12 m/s, yellow: isobars; position
of vertical cross sections R and S indicated
|
13 November 1997/00.00 UTC - Meteosat IR image; magenta: relative streams 311K - system velocity 236° 12 m/s, yellow: isobars; position
of vertical cross sections R and S indicated
|
|
|
|
Relative streams on 311K (left image) and 312K (right image) clearly show in the leading part of the frontal cloud band where the intensive thunderstorm clusters developed a strongly ascending relative stream from south-east, which can be called a Warm Conveyor Belt and is defined from 700 hPa upwards.
|
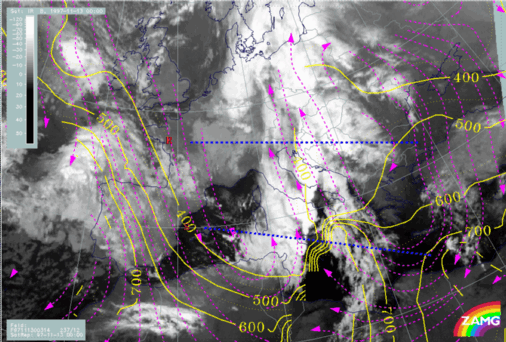
13 November 1997/00.00 UTC - Meteosat IR image; magenta: relative streams 314K - system velocity 237° 12 m/s, yellow: isobars; position
of vertical cross sections R and S indicated
|
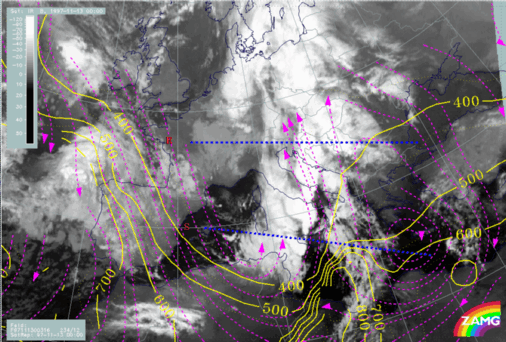
13 November 1997/00.00 UTC - Meteosat IR image; magenta: relative streams 316K - system velocity 234° 12 m/s, yellow: isobars; position
of vertical cross sections R and S indicated
|
|
|
|
On 314K (left image) the layer higher than 500 hPa is defined for the northern vertical cross section (cross section R) but higher than 400 hPa for the southern vertical cross section (cross section S). While there is still a Warm Conveyor Belt in the northern cross section, in the southern cross section the much drier relative stream from behind the front has already approached the western parts of the thunderstorm cluster. This is very similar on 316K (right image) for the thunderstorm cell of the northern cross section, while for the southern Cb complexes on this surface the whole area is within the drier and colder relative stream from behind.
This situation will be of much interest for the interpretation of thunderstorms in the relevant chapter (compare Development of Thunderstorms and MCSs During the Whole Period).