SPARTACUS
| Summary |
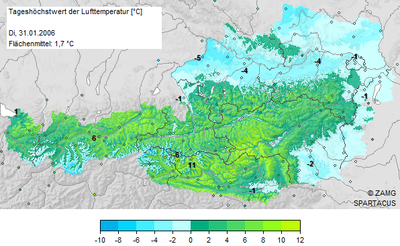
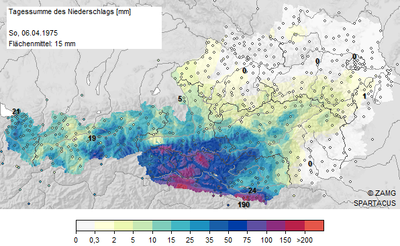
This gridded observational dataset describes the spatial distribution of daily air temperature and precipitation sum over Austria. Appropriate applications include operational climate monitoring, climate model evaluation, detection of potential climate change signals in ecological and social systems as well as quantitative process modelling, e.g. in hydrology. |
| Project targets | Creation and evaluation of a spatial climate dataset
The selected interpolation method for temperature deals explicitly with common nonlinearities in the vertical temperature structure and with topographical, non-Euclidean imprints in the spatial representativity of station observations. Precipitation analysis is a step-by-step procedure: (1) Spatial interpolation of mean monthly precipitation in the calendar month of the pertinent day through kriging with a set of predefined topographical predictors as external drift. (2) Calculation of relative anomalies of station measurements on the pertinent day with respect to the climate mean from step 1. (3) Spatial interpolation of the relative anomalies through an adapted version of the weighting algorithm SYMAP. (4) Multiplication of climate mean and anomaly fields. |
| Results | The presented dataset (SPARTACUS) contains about 61,000 grids and is updated on a daily basis. It is available for modelling, reanalysis, monitoring and planning applications in the file formats NetCDF, RDA and PNG. As for minimum and maximum air temperature, systematic leave-one-out cross-validation reveals an interpolation error (mean absolute error, averaged over all stations) of 1.1 and 1.0 °C, respectively. Larger errors have to be expected in unsampled inner-Alpine valleys, especially during inversion conditions. Visual inspection suggests that the dataset provides plausible results in situations with complex meso-scale temperature patterns. Small-scale effects in temperature distribution by local topography or land cover (e.g. forest, lakes) are not included. As for precipitation, the accuracy of the dataset depends on interpretation. Users interpreting grid point values as point estimates must expect systematic overestimates for light and underestimates for heavy precipitation as well as substantial random errors. Grid point estimates are typically within a factor of 1.5 from in situ observations. Interpreting grid point values as area mean values, conditional biases are reduced and the magnitude of random errors is considerably smaller. In addition, the systematically underestimating measurement error in input observations with respect to actual precipitation, especially in situations with strong wind and snowfall, has to be kept in mind. |
| Start of project | 04.2013 |
| End of project | 03.2016 |
| Project team | |
| Project partners | Dr. Christoph Frei, MeteoSwiss |
| Financing | ZAMG |
| Publications |


