Climate Monitoring Key
With daily updated climate monitor diagrams it is possible to compare current weather conditions to typical seasonal climate.
Air temperature, precipitation and sunshine duration are the climate elements shown – even for past years. The calendar year version provides an overview over the whole year. The 30 days version allows for a closer inspection of the most recent weeks.
With three climate elements at 30 climate stations in daily resolution, the climate monitor diagrams provide a small insight into ZAMG’s wealth of data. In fact, ZAMG’s observational network typically measures 13 quantities at more than 250 stations in a resolution of at least ten minutes. These data are used in various applications in the interests of the general public and can be provided for public and commercial purposes at any time (climate customer service).
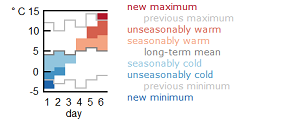
Temperature

The daily mean of air temperature given in degrees Celsius (°C) is calculated from the mean of minimum and maximum temperatures of a certain day.
If the daily temperature value is below the long-term average of the specified reference period (e.g. 1981–2010), the interval from the long-term average is depicted as a blue area. If the temperature value is above the long-term average, the interval area is shown in red. In addition, the previous minima and maxima of daily mean air temperature are plotted.
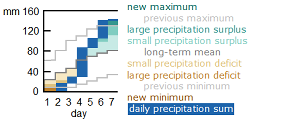
Precipitation
The daily sum of precipitation given in millimetres (mm, corresponds to litres per square metre) is captured between 7 a.m. and 7 a.m. of the subsequent day. It is shown as a dark blue bar. In addition, each bar is superimposed onto the bar of the previous day. Thus, the hitherto fallen precipitation sum is added up (cumulated) since the beginning of the year and over the most recent 30 days, respectively.
The diagonally ascending, dark grey line retraces to what extent daily precipitations sums increase in terms of the reference period’s climate mean. The two light grey line below and above it inform about the extreme cases of the (until a particular day) driest and wettest year, respectively. If the current year proves to be dry, the interval from the climate mean is shown in brown. If it turns out wet, the interval area is shown in green.
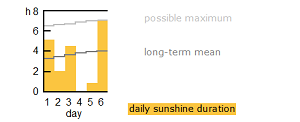
Sunshine
The daily sums of sunshine duration given in hours (h) are illustrated by yellow bars. If the station record extents sufficiently long back in time, two curves are added: The seasonal course of the long-term mean intersects the bars. The seasonal course of maximum possible sunshine duration (derived from the so far measured maxima) envelops the bars.
General
In the upper left corner of each diagram the value of the calendar year and the 30 day period, respectively, (first line) is opposed to the long-term mean of the reference period (second line). In the current year these values are valid for the time frame between the beginning of the year and the current day. Extreme values derive from the entire period since measurements started (third line).
Days with missing values are marked as grey zones. Missing data are ignored in the temperature, precipitation and sunshine values specified in the upper left corner. With more than ten days missing in the calendar year version and more than one day missing in the 30 days version, respectively, the precipitation diagram is set to no data.
The presented climate data are predominantly quality-checked and corrected at a high quality level. Ongoing data checking may still slightly alter the most recent data of the last one to three days. Breaks and trends in the record series (e.g. due to station relocation, change of instrumentation or urbanisation) have not been removed (cf. HISTALP).


